Bleedthrough matrix estimation
For both barcode and genes the first step is to generate bleed-through matrices for basecalling. This is done by using iss setup-barcodes and iss setup-omp. The principles for both are the same and they both generate diagnostics plots (see final section of the page). Here we document the barcode setup.
Setup barcode calling
The aim is to find what is the fluorescence of each base. We determine this by detecting some isolated spots, extract their fluorescence value and cluster in 4 groups. This steps depend on 4 ops parameters:
barcode_ref_tiles (default [ [ 1, 0, 0 ] ], must be changed)
barcode_detection_threshold (default 0.3)
barcode_isolation_threshold (default 0.3)
spots_extraction_radius, shared with gene rounds (default 2)
To help setting the two threshold correctly, use notebooks/select_spot_detection_thresholds.ipynb.
Extracting isolated barcode spots
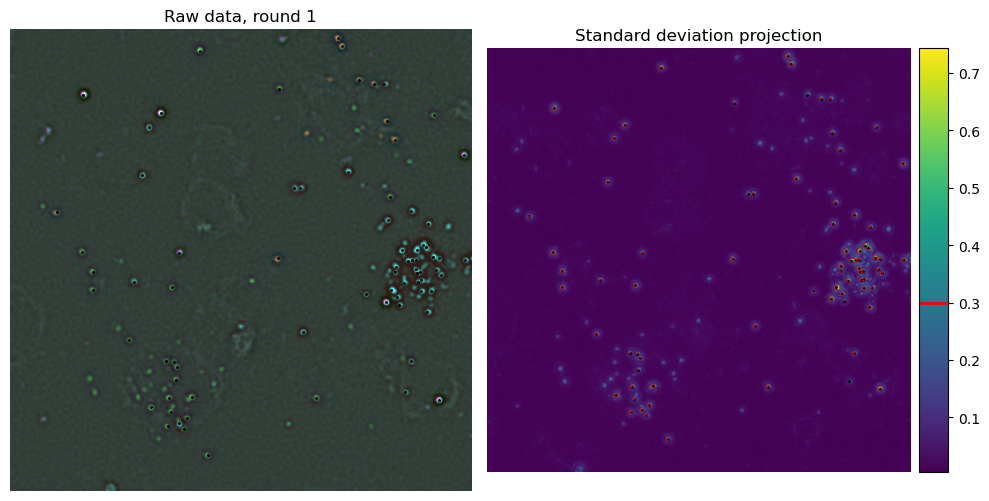
Detecting barcode spots
All barcode_ref_tiles are processed sequencialy. They are loaded and registered between channel and rounds. Then a reference image is created by taking the standard deviation of the stack. This image is used to detect spots by simple thresholding.
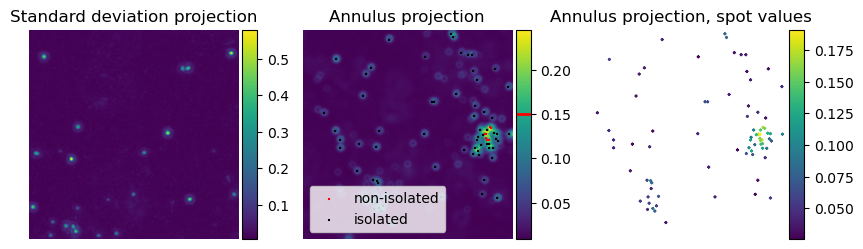
Filtering isolated spots
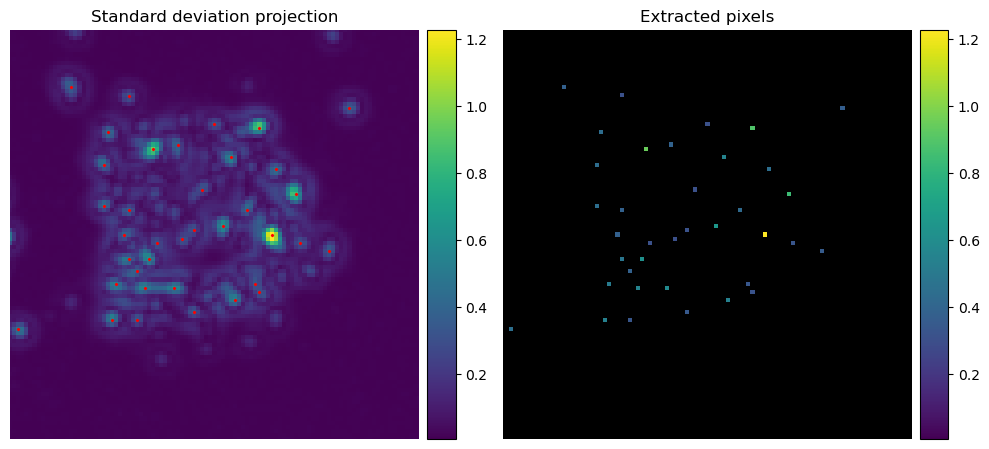
Extracting fluorescence values
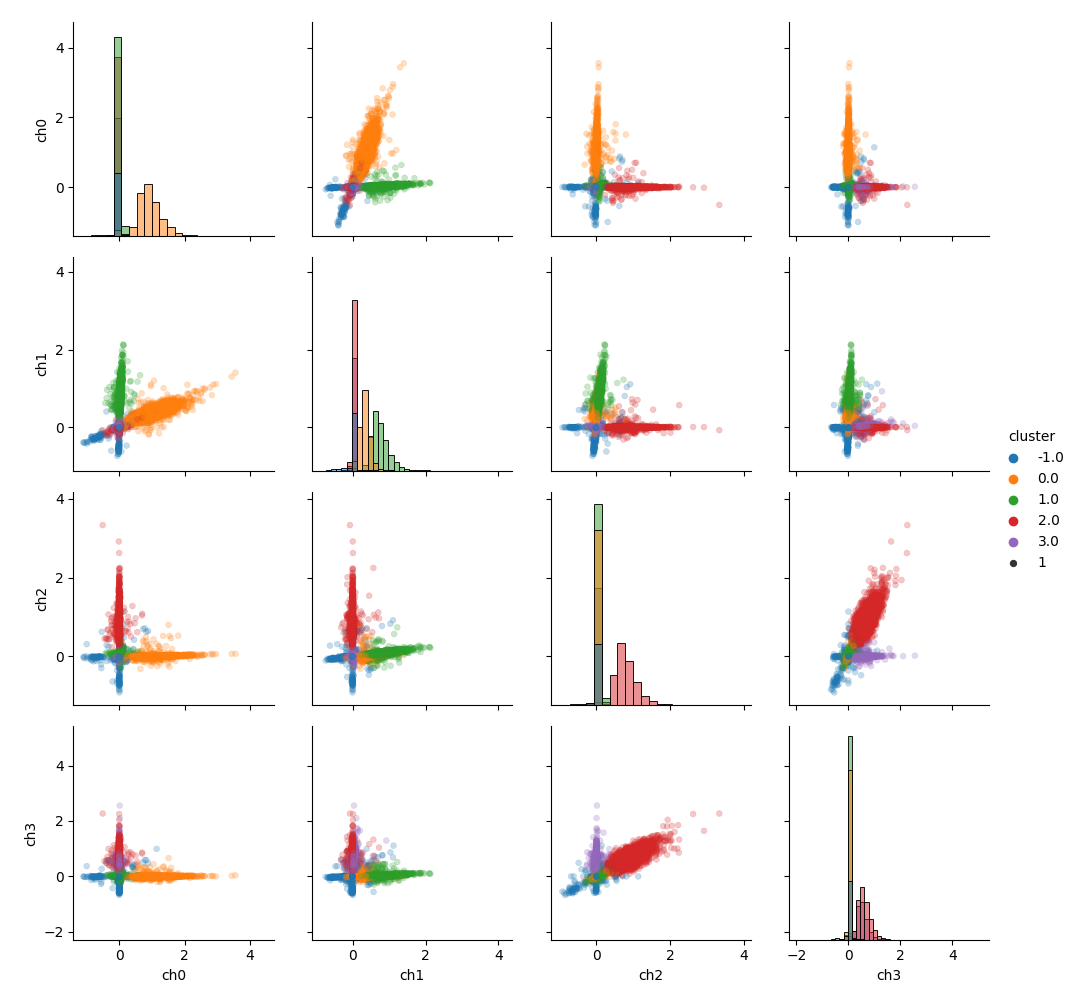
Cluster extracted data in 4 groups
The detection/extraction steps are repeated for all barcode_ref_tiles. The resulting data is then clustered in 4 groups using coppafish scaled k-means. Internally this is done in iss.call.call.get_cluster_means.
The main output of the clustering is saved in processed_path / “barcode_cluster_means.npy” The cluster assignement for each spot and their fluorescence values are saved in processed_path / “reference_barcode_spots.npz” and used to generate diagnostics plots described in the next section.
Plot diagnostics
The diagnostics plot are generated by iss.pipeline.diagnostics.check_barcode_calling, which is called automatically by iss setup-barcodes. It generates one main figure of the bleed-through matrices: processed_path / figures / ‘barcode_cluster_means.png’. This should hopefully look like this:
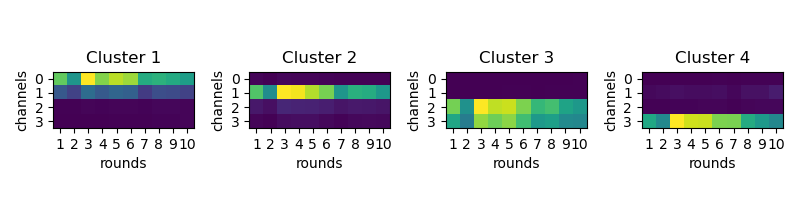
A further nrounds plots will be generated to help with debugging if the clustering went wrong. They are saved in the same folder and called barcode_clusters_round_{x}.png where x is the round number. Here is an example output of successful barcode calling: