Calling various spots
Rolonies from genes, barcodes and hybridisation need to be identified and properly
labelled. This is done by iss call but the process is different for each type of
spot.
Detecting and decoding gene spots
To detect the genes, we need to first estimate how much the fluoresence changes across rounds and channels (channel correction). Then we can make a dictionary of expected fluoresence for each gene (setup OMP) and finally run OMP on all tiles (extract tile).
        ---
config:
layout: elk
look: handDrawn
---
flowchart TD
subgraph setup_channel_correction["setup_channel_correction"]
        est["estimate_channel_correction"]
end
subgraph subGraph1["Setup OMP"]
        setup_omp["setup_omp"]
        cos("check_omp_setup")
        coat("check_omp_alpha_thresholds")
        cot("check_omp_thresholds")
end
    start["Start"] --> setup_channel_correction
    est --> setup_omp
    setup_omp --> cos & coat & cot & ext((("extract_tile")))
    est:::Sky
    setup_omp:::Sky
    cos:::Ash
    coat:::Ash
    cot:::Ash
    ext:::Sky
    classDef Ash stroke-width:1px, stroke-dasharray:none, stroke:#999999, fill:#EEEEEE, color:#000000
    classDef Sky stroke-width:1px, stroke-dasharray:none, stroke:#374D7C, fill:#E2EBFF, color:#374D7C
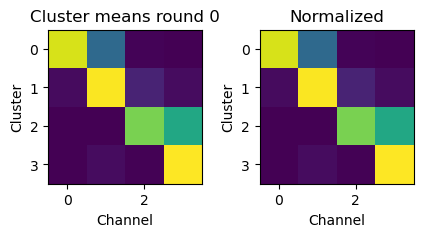
Gene dictionary estimation
The first step is to estimate the gene dictionary. This is done by finding what is the
fluoresence of each base for each round. check_omp_setup will save a diagnostics
plot as figures/sequencing/omp_cluster_means.png. It should hopefully look like the
image below.
If it doesn’t, check the figures/sequencing/omp_cluster_round_X.png to get an
idea of what went wrong. Ensure you have enough tiles in ops[f”genes_round_ref_tiles”]
. If you still don’t have enough spot, adjust ops[f”{prefix}_detection_threshold”],
ops[f”{prefix}_isolation_threshold”], and/or ops[“spot_extraction_radius”]. If you
have enough data but the clustering is wrong, change ops[“initial_cluster_means”] and
ops[“genes_cluster_score_thresh”].
We then build an expected fluoresence trace for each gene, by using the gene dictionary (found in the call folder) and the bleedthrough matrices generated above.
If it looks different from what you expected, check that you have the correct ops[“camera_order”] and dictionary.
OMP algorithm
Detecting gene spots
Detecting and basecalling barcode spots
        flowchart TD
start[Start] --> setup_channel_correction

    subgraph setup_channel_correction
        est[estimate_channel_correction]
    end

    est --> setup_barcode_calling

    setup_barcode_calling --> ext(((basecall_tile)))
Detecting barcode spots
The first step is to detect barcode spots in the images. This is done by computing the average of the filtered image across round and channels. Spot candidates are then detected with a simple threshold crossing using ops[“barcode_detection_threshold_basecalling”]. This threshold will be lower than that used to calculate bleed-through matrices as we want to include as many rolonies as possible.

Basecalling barcode spots
To sequence, we need to use the [bleedthrough matrices](bleedthrough.rst) previously computed.
For each round, the Nchannel x Ncluster bleedthrough matrix is normalized so that the length of each cluster vector is 1 (rows in the image below).
Then, we extract the fluoresence on each channel for each spot, normalize the length of this vector and calculate the dot product of the spot vector with the cluster vector. The cluster with the highest dot product is the base called for that spot.

Quality scores
Dot product score
The main quality score is the dot product score. This is the dot product of the spot fluoresence across each round with the idealised fluoresence trace, calculated from the base called sequence and the bleedthrough matrices.
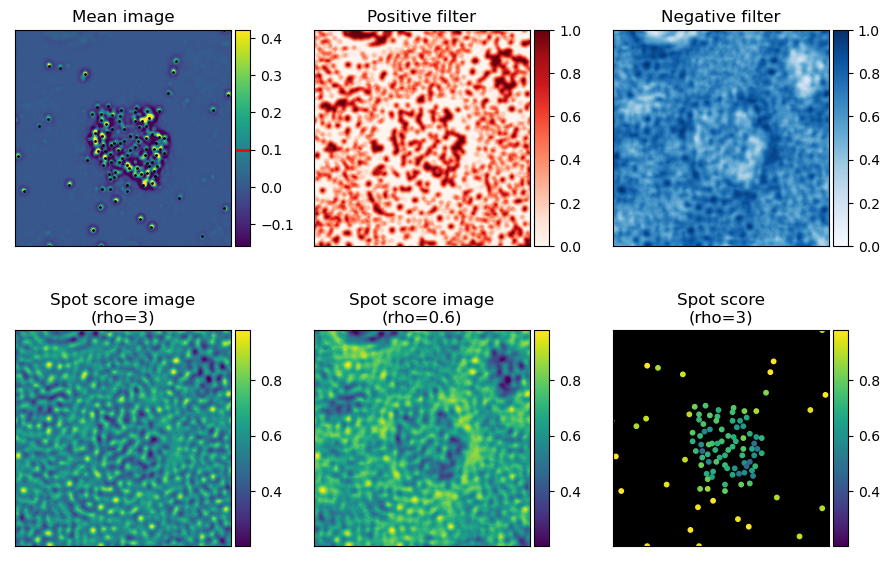
Sign spot score
Optionally, rolonies can be filtered by their spot sign score. In practice this has not been extremely useful so far as most rolonies are too densely packed. This score is an estimate of how much the spot has the same shape as an average isolated spot. This just counts the number of pixels that are positive in the middle of the spot and how many are negative in the surrounding.
First we need to take the average rolonie image and threshold it to make a spot sign image. This threshold is set by ops[“spot_shape_threshold”] (shared with genes spots)
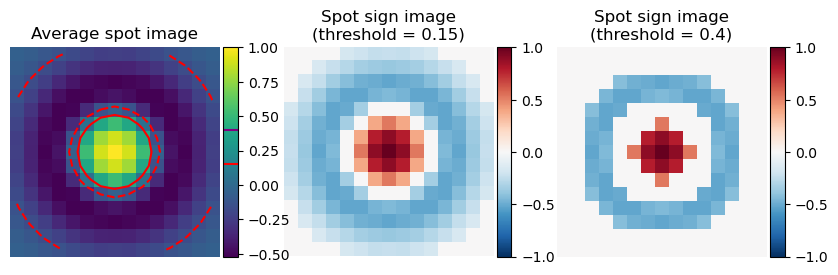
Then we calculate how many of the pixels around the rolonies have the same sign as the spot sign image. There are a lot more negative pixels, to avoid that they dominate the score too much, the relative weight of negative and positive pixels can be adjusted with ops[“barcode_spot_rho”].